
Playwright Trace Viewer: A Practical Guide to Debugging Failed Tests
Playwright Trace Viewer lets you investigate a recorded test run after it finishes. You can examine actions, page snapshots, errors, and captured network activity to understand what happened around a failure. Start with the failed step, then work backwards until you find where the application stopped behaving as expected.
Imagine a checkout test failing overnight. The report says that an order confirmation never appeared. That message identifies the missing result, but it does not explain whether payment failed, the session expired, or the test clicked the wrong button.
A trace gives you evidence to investigate those possibilities. This guide explains how to record that evidence, open it, and use it to make a precise fix.
Table of Contents
Toggle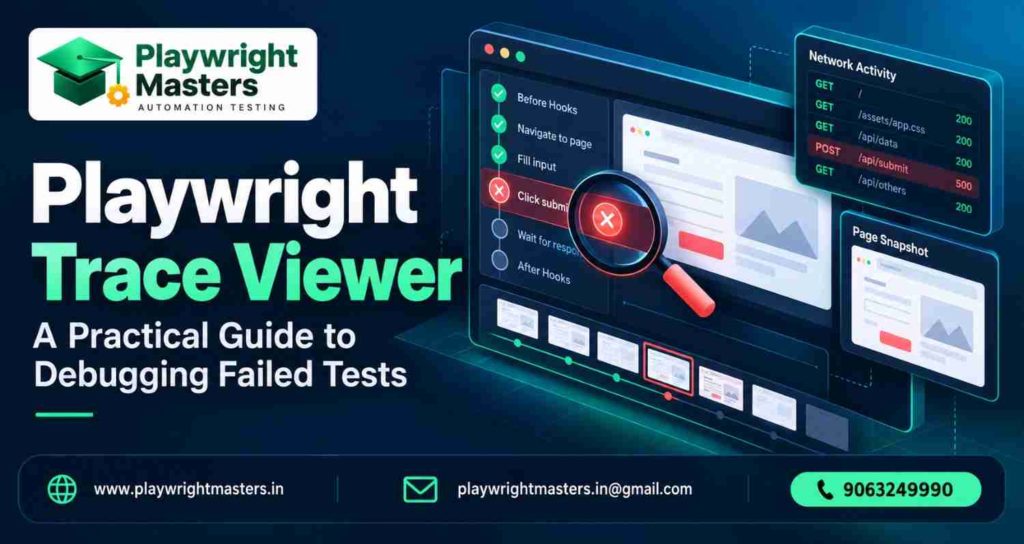
What is Playwright Trace Viewer?
Playwright Trace Viewer is a visual tool for examining saved Playwright execution traces. Think of it as a test investigation notebook: it connects recorded browser actions with the information collected around them.
A trace is not a fresh execution of your application. Looking at an earlier snapshot does not submit the original payment again or rerun your backend. You are examining captured evidence, whose detail depends on the recording settings and available data.
This makes traces useful when a failure happens on another computer, particularly a continuous integration server. You can investigate the recorded attempt without reproducing every condition immediately. The official Trace Viewer guide describes the available panels and recording workflow.
How do you record your first Playwright trace?
For a focused local investigation, run one test file with tracing enabled. Recording a small example makes the resulting evidence easier to understand than starting with an entire suite.
In an existing Playwright Test project, add this deliberately failing practice test as tests/trace-practice.spec.ts:
import { test, expect } from ‘@playwright/test’;
test(‘investigate a missing confirmation’, async ({ page }) => {
await page.setContent(`
<button onclick=”this.textContent=’Order received'”>
Place order
</button>
`);
await page.getByRole(‘button’, { name: ‘Place order’ }).click();
await expect(
page.getByRole(‘heading’, { name: ‘Order confirmed’ })
).toBeVisible({ timeout: 3000 });
});
Run it with:
npx playwright test tests/trace-practice.spec.ts –trace on –reporter=html
npx playwright show-report
The expected result is a failed assertion. The button changes its text, but the page never creates the heading requested by the test. This controlled example teaches you to separate a successful action from an incorrect expectation.
Open the failed test in the report and select its trace attachment. The official tracing introduction explains this report-to-trace workflow.
How do you open a trace.zip file?
Open a saved trace with the Playwright command below, replacing the example path with the actual file location:
npx playwright show-trace test-results/example-test/trace.zip
The directory name varies with the test, browser project, and output settings. Copy the path from your generated artifacts instead of assuming every project uses the example directory.
You can also select a local ZIP file in the browser-based viewer at trace.playwright.dev. For a downloaded CI artifact containing several files, first extract the outer artifact archive and locate the individual trace ZIP inside it.
Keep the trace ZIP itself intact when opening it. Selecting an unrelated report archive is a common reason a viewer cannot load the expected test.
Which Playwright trace mode should you choose?
Choose the recording mode according to the evidence you need. A trace of a retry is evidence of that retry; it is not a recording of the original failed attempt.
Mode | Recording and retention behavior | Useful situation |
off | No recording | Tracing is unnecessary |
on | Record and retain every attempt | Short investigation |
on-first-retry | Record and retain the first retry only | Routine CI with retries enabled |
on-all-retries | Record and retain every retry | Investigate changing retry behavior |
retain-on-failure | Record every attempt; keep failed attempts | Preserve failures, including an initial failure |
retain-on-first-failure | Record the initial attempt only; retain it if it fails | Investigate the original attempt |
retain-on-failure-and-retries | Record every attempt; keep failures and retries | Compare a failure with a passing retry |
These behaviors follow the current Playwright trace configuration reference. Check support in your installed version before adopting a mode from newer documentation.
For example, a team investigating intermittent checkout failures needs the failed attempt and the successful retry. Keeping only the retry could hide the condition that originally caused the problem.
How do you configure traces for everyday CI runs?
Use retry-based tracing when you want evidence from reruns without recording every initial attempt. Enable retries explicitly, because on-first-retry cannot capture a retry that never happens.
import { defineConfig } from ‘@playwright/test’;
export default defineConfig({
testDir: ‘./tests’,
retries: process.env.CI ? 2 : 0,
reporter: [[‘html’, { open: ‘never’ }]],
use: {
trace: ‘on-first-retry’,
},
});
With this configuration, a local failure normally produces no retry trace because local retries are zero. Use –trace on for a local investigation, or choose a retention mode that records initial attempts.
Playwright classifies a test that fails initially and passes on retry as flaky. A passing retry therefore deserves investigation rather than being treated as proof that the original result was harmless. See the retry documentation for execution and classification details.
How should you read a failed trace?
Use each panel to answer a particular question. This keeps an investigation focused when a trace contains many events.
Evidence | Question to ask |
Actions and call details | Which operation was attempted? |
Before and after snapshots | What changed around that operation? |
Source | Which test instruction produced it? |
Action log | What condition was Playwright waiting for? |
Network | Did a relevant request return the expected response? |
Console | Did application code report an error? |
Metadata | Was this the expected browser and viewport? |
For a checkout failure, start with the submit action and its nearby requests. An unrelated image error from the beginning of the test may be distracting rather than causal. Expand your search only when the immediate evidence does not explain the failure.
How do you diagnose a timeout without guessing?
A timeout means an operation did not complete within its allowed time. It does not automatically mean the timeout setting is too short.
For a click, Playwright checks conditions such as visibility, stability, enabled state, and whether the element can receive events. The auto-waiting documentation explains which checks apply to different actions.
Consider a hypothetical order form where a loading overlay remains above the submit button. The button exists, but the overlay blocks interaction. Raising the timeout might only make the failure take longer.
Investigate why the overlay remains. A pricing request might have failed, the interface might not handle an error, or the test might have skipped a required selection. Fix the demonstrated cause instead of adding a blanket delay.
Use forced clicks cautiously. Bypassing a check can make a test succeed while hiding a problem that a real user would still experience.
How can network evidence explain a UI failure?
Network evidence helps connect a missing screen element with the request that should have supplied its data. Treat the response as a clue, then verify how the application handled it.
Suppose a fictional customer dashboard stays empty after login. Investigate three possibilities separately:
- No customer request was sent: check the preceding navigation and application logic.
- The request was rejected: check the response and the test account’s access.
- The request succeeded with an empty result: check whether the test created the required customer record.
A successful status alone does not prove the expected business data arrived. The response body may contain an empty list or a different record from the one the test expects.
For deeper practice with requests and response checks, continue with the Playwright API testing guide. Keep the trace investigation focused on the request connected to the failing user journey.
How do traces help investigate authentication failures?
For an authentication failure, first establish whether the test reached the expected authenticated page. A redirect to a login screen can explain why a later dashboard locator never appears.
In a hypothetical expired-session case, the test opens a protected URL, receives a login page, and then waits for an account heading. The heading timeout is a symptom. The earlier authentication transition is the useful investigation point.
Check when the saved state was created, which environment it belongs to, and whether the account still has the required permissions. Also check whether another parallel test changed shared account data.
The Playwright authentication guide provides related learning on session reuse. If setup is shared across many tests, review your Playwright fixtures so each test receives the state it actually needs.
How do you make assertions easier to debug?
Assert the user-visible outcome that matters and add a meaningful failure message. An assertion should explain the expected behavior, rather than merely confirm that some unrelated element exists.
await expect(
page.getByRole(‘heading’, { name: ‘Order confirmed’ }),
‘A completed order should display its confirmation heading’
).toBeVisible();
Playwright’s web assertions retry while waiting for their condition. This is generally more useful than checking a changing page once and immediately comparing a boolean. The assertion documentation explains the distinction.
Keep expectations specific. Checking that the page contains the word “order” could pass on an error message such as “order could not be completed.” A precise expectation reduces misleading successes and makes the trace easier to interpret.
How do you preserve traces from CI?
Generate artifacts during the test job, then upload them even if the test command fails. Otherwise, the most useful evidence may disappear with the temporary runner.
For an existing GitHub Actions job, place an upload step after the test command:
– name: Run Playwright tests
run: npx playwright test
– name: Preserve debugging artifacts
if: ${{ !cancelled() }}
uses: actions/upload-artifact@v4
with:
name: playwright-debug-artifacts
path: |
playwright-report/
test-results/
retention-days: 7
This is a job fragment, not a complete workflow. Your job must already check out the repository and install the required Node dependencies and browsers. Use unique artifact names if several matrix jobs upload results.
The official CI setup guide provides the surrounding workflow. Choose a retention period that gives your team enough investigation time without keeping sensitive evidence indefinitely.
What if the HTML report opens but its trace does not?
Check whether you downloaded the complete report and its supporting files. A report is more than the visible HTML page; moving only that page can separate it from the attachments it references.
Open a downloaded report directory with:
npx playwright show-report path/to/playwright-report
The HTML reporter documentation explains report configuration and attachment handling. If the report link remains broken, locate the actual trace ZIP and open it directly to distinguish a report-path problem from a trace-file problem.
Should you use context.tracing instead of test configuration?
Use Playwright Test configuration for ordinary Playwright Test suites. Use context.tracing when a standalone browser script needs direct recording control.
import { chromium } from ‘playwright’;
const browser = await chromium.launch();
const context = await browser.newContext();
await context.tracing.start({
screenshots: true,
snapshots: true,
sources: true,
});
try {
const page = await context.newPage();
await page.goto(‘https://example.com’);
} finally {
await context.tracing.stop({ path: ‘trace.zip’ });
await browser.close();
}
The tracing API documentation notes a key limitation: context-level tracing captures browser operations and network activity, but not Playwright Test assertions. Avoid replacing the test runner’s integrated tracing without understanding that difference.
How is Trace Viewer different from Inspector and UI Mode?
Choose Trace Viewer for a saved run, Inspector for stepping through a live debugging session, and UI Mode for interactive test development.
Tool | Main task | Typical command |
Trace Viewer | Inspect recorded evidence | npx playwright show-trace trace.zip |
Inspector | Pause and step through execution | npx playwright test –debug |
UI Mode | Run and inspect tests interactively | npx playwright test –ui |
The debugging guide and UI Mode guide explain these live workflows. If a CI failure is hard to reproduce, preserve its trace first. Use local debugging afterwards to test your explanation.
What should you check before sharing a trace?
Treat a trace as potentially sensitive test evidence. Captured page content, requests, responses, and source files may reveal information that should stay inside your team.
Use test accounts and artificial customer data. Keep CI artifacts access-controlled, follow your organization’s retention policy, and review evidence before attaching it to a public issue.
The hosted viewer processes a selected local trace in the browser, according to Playwright’s documentation. That does not make a publicly uploaded artifact private. Storage permissions and the viewer’s processing behavior are separate concerns.
How do you turn trace evidence into a useful bug report?
A useful bug report connects an observable failure to specific evidence without presenting an untested theory as fact. Include the test name, environment, attempt, expected outcome, and the action where behavior first diverged.
For a fictional checkout investigation, a clear note might read: “The submit click completed. The order request returned an error response. The confirmation heading never appeared. The trace is attached in the private CI artifact.” This separates what happened from why you think it happened.
Avoid writing “the database is broken” unless you have supporting backend evidence. A browser trace may reveal the failed response without showing the internal database operation that produced it.
After a fix, repeat the same journey and compare the relevant evidence. Confirm that the intended outcome now occurs and that the test still detects the original problem when reproduced in a controlled environment.
Keep a short investigation record containing the evidence, confirmed cause, change, and verification result. Over time, these records help your team recognize recurring setup mistakes and decide which checks belong earlier in the test workflow. They also make debugging knowledge easier to share with someone who did not investigate the original failure.
Frequently asked questions
Why is my Playwright trace missing?
Check the recording mode first. With on-first-retry, no retry means no trace. Also check the output directory, retention behavior, and whether the CI job uploaded its artifacts successfully.
Can Trace Viewer fix flaky tests automatically?
Trace Viewer supplies evidence; it does not establish the correct fix by itself. Compare failed and successful attempts, identify a supported explanation, and verify the change with another run.
Is a trace the same as a video?
No. A video shows visual progression, while a trace connects recorded actions with diagnostic evidence. Use visual evidence to find the moment of interest, then investigate the action and related data.
Should every test always record a trace?
Not necessarily. Consider recording overhead, artifact storage, and investigation needs. Use broad tracing temporarily when diagnosing a specific problem, then choose a sustainable policy for normal runs.
Can a passing test still need investigation?
Yes. A test that passes after a failed attempt may indicate inconsistent application behavior, shared data, or a test problem. Compare attempts instead of assuming the later pass invalidates the earlier failure.
Build a repeatable debugging habit
Before changing a failed test, write down three things: the expected result, the observed result, and the earliest evidence explaining their difference. This small habit helps prevent unrelated edits and makes your reasoning easier for a teammate to review.
For structured practice across locators, assertions, API checks, and debugging, explore the Playwright Automation Testing Course in Hyderabad. Use each practice failure to learn how to explain a cause clearly, not simply how to obtain a green test result.

Playwright Masters Team
Playwright Automation Testing Experts | Industry-Focused Training & Practical Learning
Playwright Masters is a dedicated automation testing training platform focused on helping learners build practical skills in Playwright automation testing. Our training covers real-world automation concepts, framework practices, coding, debugging, API testing, cross-browser testing, CI/CD, and interview preparation to help learners develop job-ready testing skills.