
Playwright Debugging: Complete Guide to Debug Failed Tests
Playwright tests can look perfect when you write them. Then you run the test and suddenly see a timeout, locator error, navigation failure, or unexpected result.
The important question is not simply:
“How can I make the test pass?”
The better question is:
“Why did the test fail?”
That is where Playwright debugging becomes important.
Table of Contents
TogglePlaywright provides several tools for finding the real cause of a failed test, including Playwright Inspector, page.pause(), VS Code debugging, UI Mode, Trace Viewer, screenshots, videos, logs, and browser developer tools.
This guide explains Playwright debugging from beginner level to real-world troubleshooting.
You will learn how to debug:
- Failed locators
- Timeout errors
- Assertion failures
- Navigation problems
- Authentication issues
- Popups and multiple tabs
- Iframes
- Network failures
- Flaky tests
- CI/CD failures
- Browser launch problems
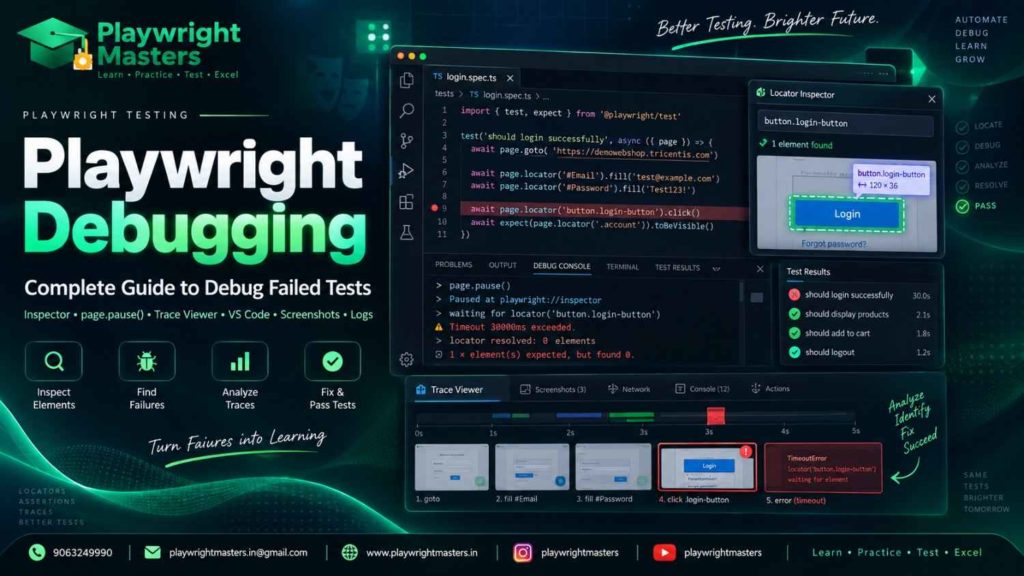
What Is Playwright Debugging?
Playwright debugging is the process of finding the exact reason why a Playwright test does not behave as expected and then fixing the underlying problem.
For example, imagine this test:
await page.getByRole('button', { name: 'Login' }).click();
The test fails with a timeout.
A beginner may immediately increase the timeout.
A better debugging process asks:
- Is the page actually open?
- Is the Login button present?
- Does the button have the expected accessible name?
- Are there multiple Login buttons?
- Is the button inside an iframe?
- Is a popup covering it?
- Did authentication or navigation change the page?
- Is the application still loading?
- Is the test running against the correct environment?
The goal of debugging is therefore not to hide the error.
The goal is to understand the error.
For current debugging features, see the official Playwright debugging documentation.
Why Do Playwright Tests Fail?
A Playwright test can fail for many different reasons.
The failure does not always mean that Playwright is broken.
Often, the test, application, test data, environment, or timing is responsible.
Common causes include:
Problem | Typical symptom |
Wrong locator | Locator cannot find the element |
Multiple matches | Strict mode violation |
Element hidden | Actionability timeout |
Slow application | Timeout |
Wrong URL | Navigation/assertion failure |
Authentication issue | User remains on login page |
iframe | Element cannot be found |
Popup | Expected page is missing |
Network problem | Request fails or hangs |
Test data problem | Expected record does not exist |
Race condition | Test passes sometimes |
CI environment | Works locally but fails in CI |
Browser issue | Browser fails to launch |
Configuration issue | Unexpected browser/project behavior |
The first debugging skill is learning to read the failure before changing the code.
A Simple Playwright Debugging Workflow
When a Playwright test fails, follow this process:
1. Run the test
Start by reproducing the failure.
npx playwright test login.spec.ts
2. Read the complete error
“Don’t rely only on what appears in the last line.”
Look for:
- Failed assertion
- Locator
- URL
- Timeout
- Expected value
- Actual value
- Call log
- Source-code location
3. Identify the exact failed action
For example:
waiting for getByRole('button', { name: 'Login' })
Now you know Playwright was waiting for the Login button.
4. Reproduce the problem
Run the test again.
If possible, run only the failing test.
5. Inspect the browser
Use headed mode, Inspector, UI Mode, or VS Code.
6. Check the locator
Ask:
“Does my locator match the element I intend to test?”
7. Check timing
Do not immediately add waitForTimeout().
Playwright already provides auto-waiting for many actions and assertions.
8. Check the page state
Look at:
- Current URL
- DOM
- Visible elements
- Console messages
- Network requests
- Authentication state
9. Choose the correct debugging tool
Use Inspector for live debugging.
Use UI Mode for interactive test exploration.
Use Trace Viewer when you need to understand a recorded failure.
Use screenshots and videos when visual evidence is useful.
10. Fix the root cause
Finally, run the test again.
This process is much better than randomly increasing timeouts.
Playwright Debugging Tools
Here is a quick comparison.
Tool | Best use | Beginner friendly? | Main limitation |
Playwright Inspector | Step through a live test | Yes | Requires interactive execution |
page.pause() | Stop at an exact point | Yes | Mainly useful during local debugging |
--debug | Quickly enter debug mode | Yes | Not ideal for CI |
VS Code debugger | Breakpoints and source-level debugging | Yes | Requires VS Code setup |
UI Mode | Explore and debug tests interactively | Yes | Mainly a local development workflow |
Trace Viewer | Investigate completed failures | Yes | Requires a recorded trace |
Screenshot | See visual state | Yes | Only shows one captured moment |
Video | See browser actions over time | Yes | Less detailed than a trace |
Console logs | Inspect values and application messages | Yes | Logs alone may not explain UI state |
Test report | Review failed tests and attachments | Yes | Summary rather than live debugging |
Browser DevTools | Inspect DOM/network/console | Intermediate | Requires browser debugging knowledge |
Playwright’s official documentation recommends modern debugging workflows such as VS Code, UI Mode, Inspector, and Trace Viewer depending on the situation.
How to Use Playwright Inspector
The Playwright Inspector is a graphical debugging tool that lets you pause and step through Playwright tests.
It can show:
- The current test action
- Locator information
- Actionability logs
- Matching elements
- Browser state
- Locator picker
Playwright’s --debug mode opens the Inspector and launches the browser in headed mode. It also sets the default timeout to zero for debugging.
Start Playwright Debug Mode
Run:
npx playwright test --debug
Now Playwright opens the Inspector and browser.
You can move through the test step by step.
You can also debug one test:
npx playwright test tests/login.spec.ts --debug
Or target a particular line:
npx playwright test tests/login.spec.ts:15 --debug
This is useful when a large test file contains many tests and you only want to investigate one failure.
How Does page.pause() Work?
Sometimes you do not want to step through the entire test.
You already know approximately where the problem happens.
For example:
import { test, expect } from '@playwright/test';

test('login test', async ({ page }) => {
  await page.goto('https://example.com/login');

  await page.getByLabel('Email').fill('user@example.com');
  await page.getByLabel('Password').fill('password');

  await page.pause();

  await page.getByRole('button', { name: 'Login' }).click();

  await expect(page.getByText('Dashboard')).toBeVisible();
});
When Playwright reaches:
await page.pause();
execution stops.
You can inspect the page before continuing.
“This is especially valuable when you need to find out why:”
- A locator
- A dropdown
- A popup
- A form
- A dynamic element
- A navigation state
The official Playwright debugging guide documents page.pause() as a way to create a targeted breakpoint rather than stepping through every previous action.
Debugging Locators in Playwright
Locator problems are among the most common causes of Playwright failures.
Consider:
await page.locator('.login-button').click();
The test fails.
Instead of guessing, inspect the page and ask:
Does .login-button still exist?
A better locator may be:
await page.getByRole('button', { name: 'Login' }).click();
Playwright recommends user-facing locators such as roles and labels where appropriate because they better represent how users interact with the page.
Useful locator choices
page.getByRole('button', { name: 'Login' });
page.getByLabel('Email');
page.getByPlaceholder('Enter email');
page.getByText('Welcome');
page.getByTestId('login-button');
Avoid extremely fragile selectors such as:
page.locator(
  '#app > div:nth-child(2) > div:nth-child(3) > button'
);
The more a selector depends on DOM structure, the easier it can be for a harmless UI change to break the test.
Debugging Strict Mode Violations
A common error looks like:
strict mode violation
This usually means your locator matched more than one element while Playwright expected one.
For example:
await page.getByRole('button', { name: 'Save' }).click();
Suppose the page contains two Save buttons.
Playwright cannot safely decide which one you mean.
Instead, make the locator more specific:
const settings = page.getByRole('dialog', { name: 'Settings' });

await settings.getByRole('button', { name: 'Save' }).click();
You can also inspect matching elements during debugging.
The important lesson is:
Do not solve a strict-mode problem by randomly choosing .first() unless the first element is genuinely the intended element.
Debugging Timeout Errors
A timeout does not automatically mean:
“The application is too slow.”
It means Playwright waited for a condition and did not get the expected result within the allowed time.
For example:
await page.getByRole('button', { name: 'Checkout' }).click();Possible causes include:
- Button does not exist
- Button has a different name
- Button is inside an iframe
- Button is hidden
- A modal blocks it
- User is not logged in
- Wrong page loaded
- Application failed to render
- Network request failed
Do not immediately do this:
await page.waitForTimeout(10000);
This adds a fixed delay but may not solve the real problem.
Instead, determine what Playwright is actually waiting for.
For example:
await expect(
  page.getByRole('button', { name: 'Checkout' })
).toBeVisible();
Then investigate why the condition is not becoming true.
Playwright’s locator and assertion APIs are designed around auto-waiting and retryability, so understanding the condition being waited for is more useful than adding arbitrary sleeps.
Debugging Assertions
Suppose you have:
await expect(page).toHaveURL('/dashboard');
The test fails.
Do not assume the URL assertion is wrong.
First inspect:
console.log(await page.url());
You may discover:
https://example.com/login
instead of:
https://example.com/dashboard
Now the actual problem may be authentication.
The assertion was simply the place where the problem became visible.
This is an important debugging principle:
The failed line is not always the root cause.
Debugging Authentication Problems
Authentication failures can be confusing.
A test may appear to fail at:
await expect(page.getByText('Dashboard')).toBeVisible();
But the real problem happened earlier.
The application may have redirected the user back to:
/login
During debugging, check:
console.log(await page.url());
You can also inspect cookies, local storage, and the authentication flow.
If your project uses Playwright’s authentication state, review your storageState setup and make sure the saved authentication state is valid for the environment being tested.
For a broader Playwright learning path, you can connect this topic with your site’s Playwright Authentication content if that page exists.
Debugging Iframes
An iframe creates a separate browsing context.
This locator may fail:
await page.getByRole('button', { name: 'Pay' }).click();
because the button is actually inside an iframe.
Use a frame locator:
const paymentFrame = page.frameLocator('#payment-frame');

await paymentFrame
  .getByRole('button', { name: 'Pay' })
  .click();
If the locator works outside the frame but fails inside the application, always ask:
“Is the element actually inside an iframe?”
This simple question can save a lot of debugging time.
Debugging Popups and Multiple Pages
Modern applications can open:
- New tabs
- New windows
- OAuth pages
- Payment pages
- External authentication pages
If your test expects a new page, explicitly capture it.
const newPagePromise = context.waitForEvent('page');

await page.getByRole('link', { name: 'Open payment' }).click();

const newPage = await newPagePromise;

await newPage.waitForLoadState();
console.log(await newPage.url());
If you do not capture the new page, you may continue interacting with the old page and think that the locator is broken.
Debugging Network Problems
Sometimes the UI is not the real problem.
The browser may be waiting for an API response that never arrives.
Playwright allows you to monitor network traffic. Requests made by the page, including XHR and fetch requests, can be observed and handled through its network APIs.
For example:
page.on('request', request => {
  console.log('REQUEST:', request.method(), request.url());
});

page.on('response', response => {
  console.log('RESPONSE:', response.status(), response.url());
});
This can help you discover:
- 404 responses
- 401 authentication errors
- 403 permission errors
- 500 server errors
- Slow API responses
- Incorrect API endpoints
For deeper investigation, the Network tab in Trace Viewer can show requests associated with individual actions.
Using VS Code to Debug Playwright Tests
If you use Visual Studio Code, Playwright’s VS Code integration can make debugging easier.
You can:
- Run individual tests
- Set breakpoints
- Debug tests
- See failures
- Show the browser
- Pick locators
- Inspect traces
For example, your code can contain:
test('checkout', async ({ page }) => {
  await page.goto('/products');

  await page.getByRole('button', { name: 'Buy now' }).click();

  // Set a breakpoint here
  await expect(page.getByText('Checkout')).toBeVisible();
});
Run the test through the VS Code testing interface and use the debugger to stop at the breakpoint.
The official VS Code integration supports running and debugging tests directly from the Testing sidebar and includes features such as browser display and locator picking.
Playwright UI Mode
A useful current debugging option is UI Mode.
Start it with:
npx playwright test --ui
UI Mode provides an interactive interface where you can:
- Run individual tests
- Filter tests
- Watch tests
- Inspect test steps
- View traces
- Explore DOM snapshots
- Move backward and forward through actions
For beginners, UI Mode can be easier to understand than reading a long terminal output because you can visually follow what happened during the test.
Debugging with Trace Viewer
Trace Viewer is especially useful when you cannot watch the test live.
Think of a trace as a flight recorder for your test.
It can help you inspect:
- Test actions
- DOM snapshots
- Screenshots
- Action timings
- Console messages
- Network requests
- Source code
- Metadata
- Attachments
A typical CI configuration can use:
import { defineConfig } from '@playwright/test';
export default defineConfig({
  use: {
    trace: 'on-first-retry',
  },
});
You can also record traces locally:
npx playwright test --trace on
The current Playwright documentation uses on-first-retry as the default trace strategy in CI-oriented examples, rather than recording a full trace for every normal test execution.
After the test finishes, open the HTML report and inspect the trace.
When debugging complex Playwright tests, understanding how fixtures handle setup, dependencies, and cleanup can make failures much easier to troubleshoot. Learn more in our Playwright Fixtures guide.
What Should You Look for in Trace Viewer?
Suppose this action failed:
await page.getByRole('button', { name: 'Submit' }).click();
Open the trace.
Then inspect:
Before
Was the Submit button visible?
Action
What locator did Playwright use?
After
Did the page change?
DOM snapshot
Was the expected element actually present?
Network
Was an API request failing?
Console
Did the application report an error?
This gives you much more information than:
Test failed.
The Trace Viewer also lets you inspect network requests and action-specific information.
Screenshots for Playwright Debugging
Screenshots are useful when you want to know what the browser looked like at a particular moment.
For example:
await page.screenshot({
  path: 'debug-login.png',
  fullPage: true,
});
A screenshot can reveal:
- Unexpected modal
- Login page
- Error message
- Missing button
- Incorrect layout
- Wrong environment
- Blank page
But a screenshot has a limitation.
It shows what the page looked like, not everything that happened before it.
For complicated failures, use a trace as well.
Videos for Playwright Debugging
Videos are useful when the sequence of actions matters.
For example:
import { defineConfig } from '@playwright/test';

export default defineConfig({
  use: {
    video: 'on-first-retry',
  },
});
Playwright supports video modes such as:
- off
- on
- retain-on-failure
- on-first-retry
A video can help you see:
- The page loads.
- A menu opens.
- A popup appears.
- The test clicks something.
- The application changes state.
- The failure happens.
However, video is visual evidence.
Trace Viewer usually provides richer debugging information because it connects actions with DOM snapshots, logs, network activity, and other test information.
Console Logging
Sometimes the easiest debugging tool is still:
console.log();
For example:
console.log('Current URL:', await page.url());
console.log(
  'Title:',
  await page.title()
);
You can also log test data:
console.log('Username:', username);
console.log('Order ID:', orderId);
For browser console messages:
page.on('console', message => {
  console.log(
    `[Browser Console] ${message.type()}: ${message.text()}`
  );
});
This is especially useful when the application itself reports JavaScript errors.
Important: never print passwords, access tokens, API keys, or other secrets into CI logs.
Debugging Flaky Playwright Tests
A flaky test is a test that does not produce the same result consistently under the same intended conditions.
For example:
Run 1 → Pass
Run 2 → Pass
Run 3 → Fail
Run 4 → Pass
Run 5 → Fail
Do not immediately add:
retries: 5
Retries can tell you that a problem is intermittent, but they do not explain why.
Common causes include:
- Race conditions
- Weak locators
- Shared test state
- Unstable test data
- Network dependencies
- Slow application rendering
- Authentication state problems
- Parallel execution
- Environment differences
First capture evidence.
Use:
trace: 'on-first-retry'
Then inspect the failed run.
A good debugging question is:
“What changed between the passing run and the failing run?”
Debugging Tests That Fail Only in CI
This is one of the most important real-world Playwright debugging problems.
A test works on your laptop but fails in GitHub Actions or another CI environment.
Possible differences include:
- Browser version
- Operating system
- Environment variables
- Network speed
- CPU resources
- Test data
- Authentication
- Parallel workers
- Time zone
- Headless execution
Start with the CI test report and trace.
Playwright’s documentation recommends Trace Viewer for CI debugging because it provides a detailed view of the test execution rather than relying only on screenshots or videos.
For browser-launch failures, Playwright also supports the DEBUG environment variable. For example:
DEBUG=pw:browser npx playwright test
This can provide additional browser-launch debugging information.
Debugging Parallel Test Failures
Parallel testing can expose problems that never appear when tests run one at a time.
For example:
Test A creates customer “John”
Test B deletes customer “John”
Test A expects “John” to exist
If both tests run at the same time, the result may become unpredictable.
When investigating a suspicious failure, temporarily reduce concurrency and reproduce the problem.
The important question is:
Does the failure disappear when the test runs alone?
If yes, investigate:
- Shared database records
- Shared files
- Shared accounts
- Shared browser state
- Test data collisions
- Global application state
Do not assume that the browser is responsible.
The problem may be test isolation.
Debugging Browser Launch Errors
If Playwright cannot start the browser, the failure occurs before your actual test logic can run.
For example:
Error: Failed to launch browser
First check:
- Browser installation
- Playwright version
- Operating-system dependencies
- CI environment
- Browser executable
- Permissions
Use:
DEBUG=pw:browser npx playwright test
for additional browser-launch information.
A Real-World Debugging Example
Imagine this test:
test('user can complete checkout', async ({ page }) => {
  await page.goto('/shop');

  await page.getByRole('button', { name: 'Add to cart' }).click();

  await page.getByRole('link', { name: 'Checkout' }).click();

  await expect(page.getByRole('heading', { name: 'Checkout' }))
    .toBeVisible();
});
The test fails at:
await page.getByRole('link', { name: 'Checkout' }).click();
Bad debugging approach
You might write:
await page.waitForTimeout(5000);
Then try again.
It still fails.
Better debugging approach
Start:
npx playwright test --debug
Inspect the page.
You discover the application shows:
Cart (1)
but there is no Checkout link.
The cart drawer contains a button:
Proceed to checkout
The locator was wrong.
Fix:
await page
  .getByRole('button', { name: 'Proceed to checkout' })
  .click();
The problem was not timing.
It was the locator.
This is why good debugging starts with evidence instead of guesses.
The Debugging Decision Tree
When a Playwright test fails, use this simple decision tree.
Is there a locator error?
Check:
- Element name
- Role
- Text
- Frame
- Visibility
- Number of matches
Is there a timeout?
Check:
- What Playwright was waiting for
- Current URL
- Application state
- Network requests
- Authentication
- Locator
Is there an assertion failure?
Check:
- Expected value
- Actual value
- Page state
- Previous action
Does it fail only sometimes?
Check:
- Race conditions
- Test data
- Shared state
- Parallel execution
- Network
- Application rendering
Does it fail only in CI?
Check:
- Trace
- Browser/environment differences
- CI logs
- Test artifacts
- Authentication
- Environment variables
Does the browser fail to launch?
Check:
DEBUG=pw:browser npx playwright test
Playwright Debugging Best Practices
1. Read the error before changing code
The error message often contains the first useful clue.
2. Debug the root cause
Do not treat every timeout as a timing problem.
3. Prefer reliable locators
Use roles, labels, text, and explicit test IDs where appropriate.
4. Avoid unnecessary hard waits
This:
await page.waitForTimeout(5000);
should not become the default solution.
5. Use page.pause() for targeted debugging
It lets you stop exactly where you need to inspect the application.
6. Use Trace Viewer for difficult failures
Especially when the failure happened in CI.
7. Keep evidence
Screenshots, traces, videos, and logs can turn a mysterious failure into an understandable one.
8. Check the application, not only the test
The test may be correctly reporting an application problem.
9. Investigate flaky tests instead of hiding them
Retries can be useful, but they should not replace root-cause analysis.
10. Make tests independent
Parallel execution becomes much safer when tests do not depend on each other’s state.
Playwright Debugging Cheat Sheet
Situation | Try this first |
Need live step-by-step debugging | npx playwright test --debug |
Need to stop at one point | await page.pause() |
Need source breakpoints | VS Code debugger |
Need interactive test exploration | npx playwright test --ui |
Locator does not work | Inspector / locator picker |
CI failure | Trace Viewer |
Need visual evidence | Screenshot |
Need action sequence | Video |
Need application values | console.log() |
Need network evidence | Trace Network tab / network listeners |
Browser launch failure | DEBUG=pw:browser |
Intermittent failure | Trace + test isolation |
Multiple matching elements | Inspect locator matches |
iframe failure | frameLocator() |
Popup failure | Listen for new page |
Frequently Asked Questions About Playwright Debugging
How do I debug a Playwright test?
Run the test with:
npx playwright test --debug
Then use Playwright Inspector to pause, step through actions, inspect locators, and examine the browser state.
What does page.pause() do in Playwright?
page.pause() stops test execution at that exact point so you can inspect the browser and debug the next actions interactively.
await page.pause();
How do I debug Playwright tests in VS Code?
Install the Playwright VS Code extension, open the Testing sidebar, select the test, and run it in debug mode. You can use breakpoints and inspect the browser while the test executes.
What is the difference between Playwright Inspector and Trace Viewer?
Inspector is mainly for debugging a test while it is running.
Trace Viewer is mainly for investigating a recorded test execution after it has happened.
Trace Viewer can provide action details, DOM snapshots, screenshots, network requests, console information, and metadata.
How do I debug a Playwright timeout?
First identify what Playwright was waiting for.
Then check:
- Locator
- Visibility
- URL
- Authentication
- iframe
- Network
- Application state
Do not automatically increase the timeout.
How to Diagnose and Fix Flaky Playwright Tests?
Capture a trace, reproduce the failure, compare passing and failing executions, and investigate timing, test isolation, data, network, and parallel execution.
How to Troubleshoot Playwright Failures in CI?
Use the Playwright HTML report and Trace Viewer. Configure traces such as:
use: {
  trace: 'on-first-retry',
}
Then inspect the trace from the failed CI run. Playwright specifically recommends traces as a powerful way to investigate CI failures.
Can I debug Playwright network failures?
Yes. Playwright provides APIs for monitoring and modifying network traffic, and Trace Viewer provides a Network tab for inspecting requests associated with test actions.
Final Thoughts
Playwright debugging is not about adding more waits until a test turns green.
It is about finding the real reason the test failed.
A strong debugging workflow looks like this:
Test fails
↓
Read the error
↓
Find the failed action
↓
Inspect the page state
↓
Check the locator
↓
Check timing and application state
↓
Inspect network/authentication/frames if needed
↓
Use Inspector, UI Mode, VS Code, or Trace Viewer
↓
Identify the root cause
↓
Fix the cause
↓
Run the test again
For local interactive debugging, start with Playwright Inspector, page.pause(), VS Code, or UI Mode.
For failures that are difficult to reproduce—especially in CI—use Trace Viewer.
And remember one of the most important Playwright debugging lessons:
A failed line tells you where the test noticed the problem.It does not always show where the problem began.
If you learn to separate those two things, debugging Playwright tests becomes much easier.
Playwright Masters Team
Playwright Automation Testing Experts | Industry-Focused Training & Practical Learning
Playwright Masters is a dedicated automation testing training platform focused on helping learners build practical skills in Playwright automation testing. Our training covers real-world automation concepts, framework practices, coding, debugging, API testing, cross-browser testing, CI/CD, and interview preparation to help learners develop job-ready testing skills.